

Background:
1. Because this is a forecasting tool, the WBGT values should be interpreted like that from any other weather forecast. Over the first few days, the tool has much skill in forecasting WBGT. However this skill declines towards the end of the five-day forecast period. Consequently, its output should be considered as a rough guide of the expected WBGT.
2. The WBGT forecast is updated every day around 6:30 am and 12:30 pm.
Interpreting the Forecast:
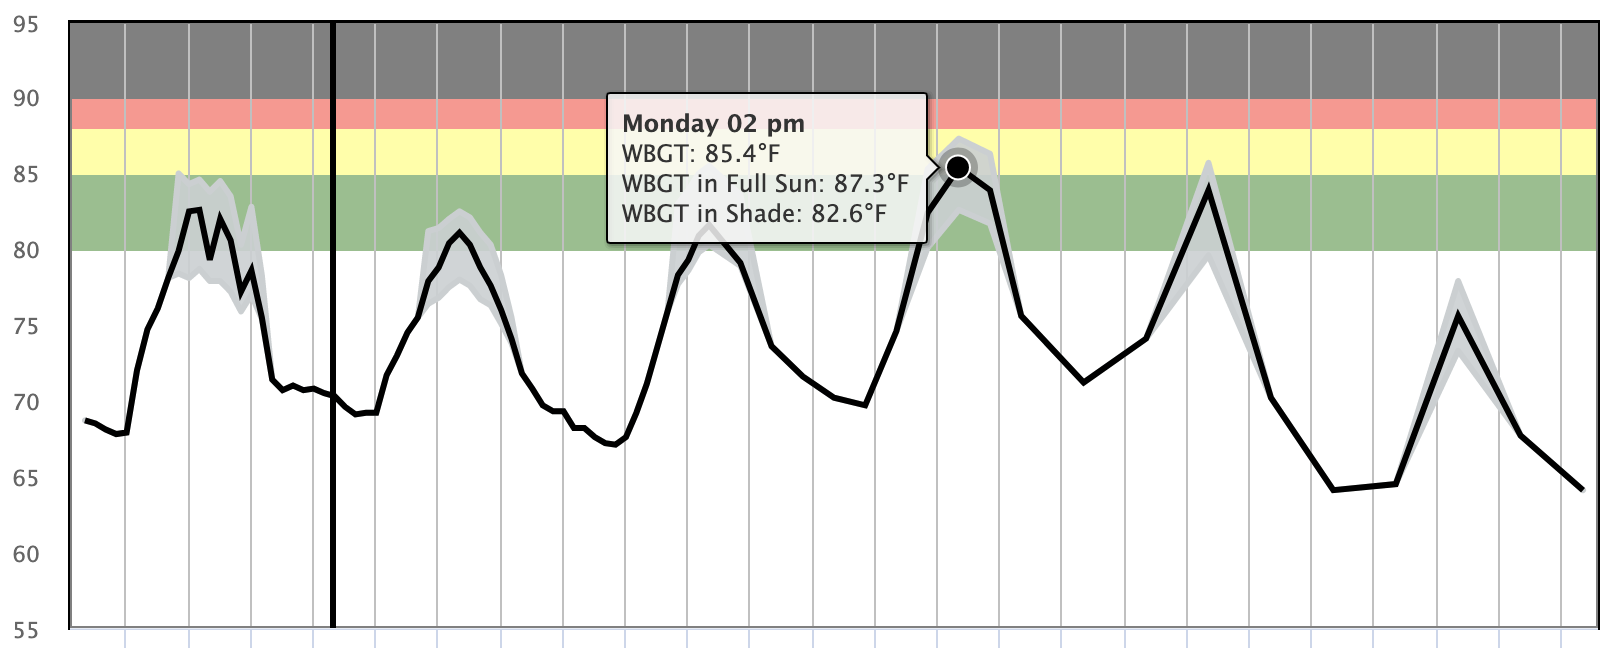
1. The undulating thick line is the predicted wet bulb globe temperature (WBGT).
2. The shaded area around the WBGT line represents the possible range of values from full sun exposure (top of shaded area in the plot) to full shade (bottom of shaded area in the plot) for WBGT. Note that shady conditions will also be observed if there is a thick overcast sky.
3. Hover your mouse over the WBGT line to see the forecasted WBGT and the range of values for varying amounts of sunlight.
4. The color bands represent warning levels as outlined by the NCHSAA. Scroll down to see recommendations for action for each warning level.